
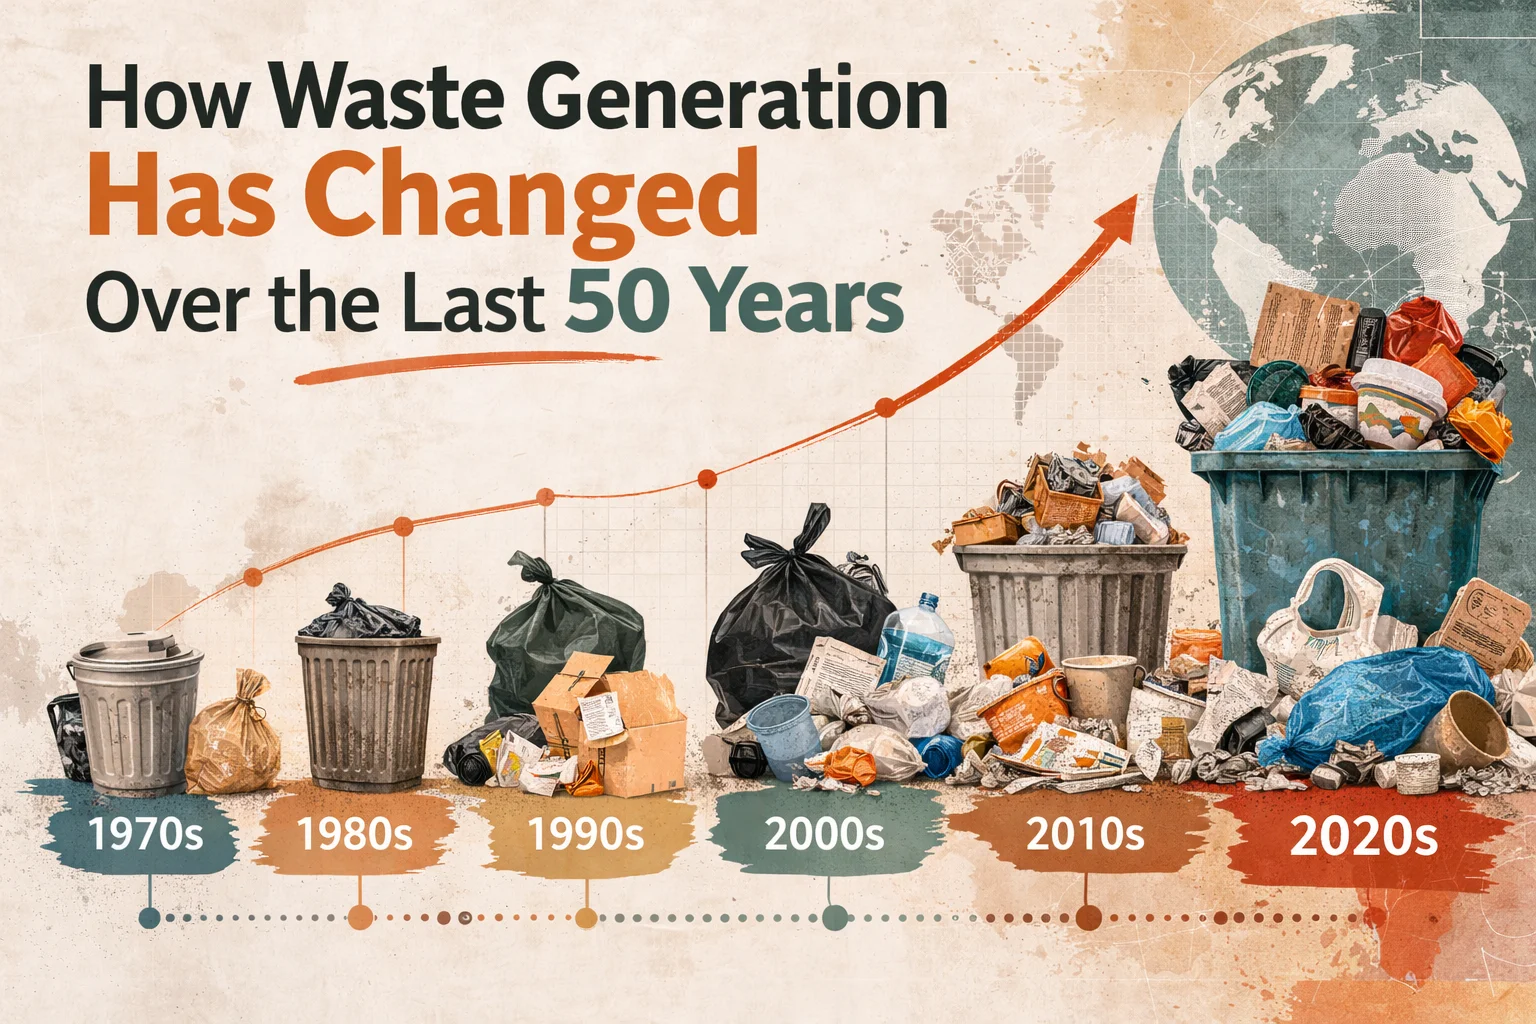
Household bin habits in the UK tell a bigger story about how we handle rubbish across the world. Over five decades the quantity and type of what we throw away have shifted as much as our lifestyles and shopping habits.
“Municipal solid waste” (MSW) covers household and similar urban refuse — food scraps, packaging, paper, textiles and small electrical items. It is the most comparable dataset for long-term comparison because it tracks material collected from cities, though it does not include industrial or large construction material.

Today the headline numbers are stark: 2.01 billion tonnes per year of MSW and an average of 0.74 kg per person per day, with a wide per-capita range from 0.11 to 4.54 kg. At least one third of that is not managed in an environmentally safe way.
The story since the 1970s is not just more people. It is also different products, new materials, changing supply chains and shifting collection systems.
This article will map drivers since the 1970s, current figures and regional shifts, collection gaps, changing composition (plastics, food, e‑waste, textiles), disposal and emissions, and future circular‑economy solutions relevant to UK policy and planning through to 2050.
Key Takeaways
- MSW offers the best long‑term comparison for urban refuse, but excludes industrial and construction flows.
- Current baseline: 2.01 billion tonnes per year and about 0.74 kg per person per day.
- Per‑capita amounts vary widely, showing clear inequality in how material is produced and managed.
- Changes since the 1970s reflect product, material and system shifts, not only population rise.
- UK supply chains and policy choices mean international streams affect costs, emissions and resource security at home.
- Projections to 2050 suggest growth will often outpace population, so planning and circular solutions are vital.
Why waste generation has shifted so dramatically since the 1970s
A mix of urban growth, higher incomes and product redesign has transformed everyday discards since the 1970s.
Population growth, urbanisation and rising consumption
Rapid population movement into cities meant more people buying from shops with packaged goods. This change raised total volumes as formal retail and single‑use packaging spread.
Higher rates of consumption and denser urban living also quickened the pace at which items are replaced, helping explain the marked increase in what is thrown away.
How income level correlates with waste generated per person
Data show a clear link between income and per capita output. High‑income countries make up about 16% of the population but produce roughly 34% of global waste — around 683 million tonnes.
This explains why per capita and capita rates differ so much between countries and why richer economies shift from organic refuse to drier, often plastic‑rich fractions.
From local litter to cross‑border streams and harder materials
Manufacturing and trade moved many streams across borders, complicating responsibility for end‑of‑life goods.
Design changes — multilayer packaging, mixed materials and short‑lived electronics — mean materials are now harder to repair, reuse or recycle. The problem is systemic: production, consumption and policy all shape the scale of waste generated.
Global waste generation trends in numbers: where we are now and where we’re heading
Numbers tell a clear story: today’s urban refuse holds clues to tomorrow’s policy and infrastructure needs.
Today’s baseline and per-capita range
Most planning uses municipal solid waste as the benchmark. Current data show about 2.01 billion tonnes per year of municipal solid material collected worldwide.
Average daily output is roughly 0.74 kg per person, but the per capita range spans from 0.11 to 4.54 kg per person per day. That range reflects income, collection coverage, urban form and reporting practice.
High-income footprint and 2050 projections
High-income countries make up about 16% of population yet produce roughly 34% of this total — near 683 million tonnes today. That disproportion shapes funding and technology debates.
Headline projections point to a rise toward about 3.40 billion tonnes by 2050. Infrastructure choices now will lock in outcomes for decades.
| Metric | Current | Per-capita note | 2050 projection |
|---|---|---|---|
| Total municipal solid waste | 2.01 billion tonnes per year | Avg 0.74 kg/person/day | ~3.40 billion tonnes |
| Per-capita range | 0.11–4.54 kg/day | Reflects income & collection | High-income +19%; low/mid +40%+ |
| High-income countries share | ≈16% pop, ≈34% total (≈683 Mt) | Higher dry recyclables share | Centre of gravity shifts to rising-income regions |
How to read these numbers
Totals show scale; per-capita figures show inequality. Reported collections omit unrecorded streams and unsafe disposal.
Growth outpacing population is driven by rising incomes, urbanisation, more packaging and faster product turnover. Prevention policy lags behind consumption in many countries.
Regional patterns over time: where total waste is growing fastest
Where total tonnage sits today is not the same as where the sharpest increases will happen tomorrow. Regional data show East Asia and the Pacific already account for roughly 23% of the world’s total waste.
By contrast, the Middle East and North Africa produce about 6% in absolute terms today. That lower share can mask very rapid future growth.
Fastest rising regions to 2050
Sub‑Saharan Africa is set to more than triple total waste by 2050. South Asia and Middle East & North Africa are each projected to roughly double.
Open dumping and its impacts
In these fast‑growth areas more than half of material is openly dumped. This means unmanaged disposal sites, burning, leachate and pest risks.
Open dumping hits health, the environment and local prosperity. It erodes tourism, reduces material value, raises healthcare costs and limits urban development.
| Region | Share today | 2050 projection |
|---|---|---|
| East Asia & Pacific | ~23% | High absolute volumes; slower growth rate |
| Middle East & North Africa | ~6% | ~Double total waste; urgent capacity need |
| Sub‑Saharan Africa | Lower today | More than triple total waste by 2050 |
For the UK, regional mismanagement still matters. Marine litter, recyclate markets and supply‑chain expectations link distant failures to domestic policy and the need for investment in prevention and collection together.
From bin to system: how waste collection has (and hasn’t) kept pace
Collection services are the hinge between what households discard and what cities can treat and recover.
Collection is the gateway service: without reliable waste collection there is no consistent feedstock for recycling, composting or safe disposal. Most effective waste management systems prioritise collection as the first operational step.
Coverage by income level
Upper‑middle and high‑income countries now offer near‑universal service, while many low‑income countries do not. In cities of low‑income countries about 48% of material is formally collected; this falls to roughly 26% outside urban areas.
Urban and rural gaps
The urban–rural divide reflects distance, poor road quality, fragmented service providers and limited budgets. These logistical and financial barriers push material into open dumping and burning, especially where formal collection is partial.
Why collection matters
Regional benchmarks make the gap clear: Sub‑Saharan Africa collects about 44%, while Europe & Central Asia and North America collect ≥90%. Shortfalls increase flood risk, disease vectors and hazards for informal workers.
- UK examples — kerbside sorting, food caddies and residual bins — show how design choices alter capture and contamination rates.
- Which materials enter treatment routes depends on collection method, frequency and segregation at source.
| Region | Estimated collection rate | Implication |
|---|---|---|
| Sub‑Saharan Africa | ~44% | Large informal sector; high open disposal |
| Low‑income countries (urban) | ~48% | Limited city coverage; rural drop to ~26% |
| Europe & Central Asia / North America | ≥90% | Enables organised recycling and controlled disposal |
Collection choices shape which materials are captured, how contaminated they are and what treatment routes become feasible. Improving this first link will be central to future management system reforms.
What we throw away has changed: global waste composition and key materials
Changes in packaging, food systems and electronics have altered the composition of municipal refuse. That shift matters for collection, treatment and future policy choices.
Why organic material still dominates
Organics remain a large share of overall refuse—often more than half on average. Food and green material drive public‑health hazards and methane emissions when dumped or landfilled.
Action on organics—like source separation and composting—delivers big climate and health benefits, especially where formal collection is limited.
How composition varies by income
High‑income areas send roughly 32% food/green and about 51% dry recyclables (plastic, paper, metal, glass) to collection. Middle‑income mixes are roughly 53% organic, while low‑income areas can be ~57% organic with only ~20% recyclables.
Key growing streams: plastics, food loss, e‑waste and textiles
Plastic volumes surged to around 400 million tonnes in 2024, about 10% of total collected mass. Plastics cause outsized harm because they persist and contaminate recycling.
About one‑third of food produced—roughly 1.3 billion tonnes—is lost or wasted. Household behaviour, retail standards and supply chain losses all add pressure to collection systems.
E‑waste (≈62 million tonnes in 2022) and textiles are rising fast. They require distinct practices: producer responsibility, separate collection points, repair networks and careful hazardous handling.
| Income level | Organic share | Dry recyclables |
|---|---|---|
| High‑income | ~32% | ~51% |
| Middle‑income | ~53% | ~30% (approx) |
| Low‑income | ~57% | ~20% |
Rising material complexity—more batteries, multilayer packaging and electronics—means design‑for‑reuse and better sorting will be essential to protect recycling quality and reduce system costs.
How disposal and treatment methods have evolved: landfills, open dumping, recycling and incineration
From open dumps to engineered sites, disposal practices reveal how mature a country’s system is.

Global split today
The current mix for municipal solid waste is roughly:
- 37% landfilled (including ~8% in sanitary landfills with gas capture)
- 31% openly dumped
- 19% recovered via recycling and composting
- 11% incinerated
Sanitary landfills versus uncontrolled dumping
Sanitary landfills use liners, leachate controls and often collect landfill gas. This reduces pollution and recovers energy.
Open dumping lacks controls. It causes persistent pollution, health risks and higher greenhouse gas releases.
Income divide and recycling limits
Controlled disposal concentrates in higher-income countries. Low-income areas still dump about 93% of material, while high-income areas dump ~2%.
Recycling has improved but faces limits. Only around 9% of plastic is successfully recycled due to contamination, mixed polymers and poor economics.
| Pathway | Share | Key implication |
|---|---|---|
| Landfills (sanitary and unmanaged) | ~37% | Gas capture reduces emissions; unmanaged sites persist |
| Open dumping | ~31% | High pollution risk; common in low-income areas |
| Recycling & composting | ~19% | Improves recovery but limited for plastics |
| Incineration (with/without energy recovery) | ~11% | Used where land is scarce; needs strict emissions controls |
EU progress shows what policy can do: municipal solid waste recycling rose from 19% in 1995 to 48% in 2022, and landfill fell from 61% to 23%. Treatment choices directly shape emissions and set the stage for climate impacts.
Climate and environmental impacts: emissions from waste generation and disposal
The way material is disposed and treated drives a sizeable share of greenhouse gases each year.
How big the problem is
Solid waste treatment and disposal produced an estimated 1.6 billion tonnes CO₂e in 2016, about 5% of global emissions. This figure covers methane and CO₂ from landfills, open dumps and basic treatment facilities.
Why methane and food matter
Methane from organic decay in landfills and open dumps is the main climate driver. Methane is short‑lived but very potent, so preventing biodegradable material from reaching landfills is high leverage.
Food loss and food waste account for nearly half of solid waste emissions in these estimates, because emissions accrue across production, transport and disposal.
If nothing changes — and wider harms
With ongoing mismanagement, emissions from the sector could rise to about 2.38 billion tonnes CO₂e per year by 2050. That path follows projected waste generation growth and continued open dumping.
Beyond climate, poor disposal practices pollute water, harm air quality from burning and let plastics leak into seas—affecting fisheries and coastal communities in the UK.
| Driver | Impact (2016) | Mitigation |
|---|---|---|
| Open dumping / unmanaged landfills | Major methane source; high emissions | Secure sites; gas collection; stop open dumps |
| Food waste | ~50% of solid waste emissions | Prevention; separate collection; composting/AD |
| Burning & poor treatment | Local air pollution; CO₂ and particulates | Controlled treatment; ban open burning |
Reducing emissions will need prevention, separate organics collection and better treatment—not only public messaging. Practical changes to collection and processing practices are the real levers.
What needs to happen next: circular economy strategies and innovation shaping the future
Practical action now — not just new kit — will determine if we slow overall material growth and cut emissions. A clear hierarchy should guide policy: prevention first, then reuse and repair, then redesign for durability and recyclability. These circular economy steps reduce pressure on municipal solid systems and lower long‑term costs.

Scaling recycling and composting
Success depends on separate collection, low contamination and stable markets for recyclate and compost. Trust in services matters: clear rules and reliable collection raise capture and quality.
Digitalisation and operational gains
Smart bins, sensors and route optimisation cut costs and improve data for planning. Better data helps target enforcement and improve collection efficiency across cities.
Energy, trade-offs and delivery models
Waste‑to‑energy can help land‑constrained areas, but it risks locking in residual streams and competing with recycling goals. Governance, enforcement and local design matter more than any single technology.
- Governance: most countries place management with local authorities; consistent oversight and laws exist in many places but enforcement varies.
- Finance: operating costs often exceed $100/tonne in high‑income settings and are near $35/tonne in lower‑income ones; transport runs ~$20–$50/tonne.
- Delivery: mix user fees, national support, producer responsibility and well‑structured public‑private partnerships with clear incentives and transparency.
| Priority | Why it matters | Practical step |
|---|---|---|
| Prevention | Reduces total material needing treatment | Regulation, product standards |
| Separate collection | Enables recycling & compost quality | Kerbside segregation, caddies |
| Funding models | Secures operations and investment | User charges, EPR, subsidies |
Conclusion
After five decades of change, the headline is clear: waste generation rose with population growth, urban living and faster consumption. Per capita habits and the mix of items in bins now shape what cities must collect and treat in the world we share.
Decision‑makers should note three figures: at least 33% of municipal refuse is not managed safely, projected totals may reach about 3.40 billion tonnes by 2050, and a do‑nothing emissions pathway could push treatment and disposal emissions to roughly 2.38 billion tonnes CO₂e per year.
Good waste management depends on systems — coverage, treatment capacity, finance and enforcement — not one-off fixes. The UK must push prevention, reuse and repair, standardise collections and speed organics diversion to cut landfill impacts and improve recycling quality.
Aligning circular‑economy policy with investment in collection and processing is the fastest route to reduce harm, protect health and limit future growth in material and emissions.
 CALL NOW